Popular Examples
- Resumes
- Cover Letters
- CVs
- Idioms
- Excel Templates
- Business Examples
- Business Letters
- Love Letters
- Personal Letters
- Science
- Math Examples
More Business
- 101 Sample Write Ups for Documenting Employee Performance Problems, Interview with Paul Falcone
- Economics by Example, Interview with David A Anderson
- Example of Pitch Letter
- Example of Business Proposals
- Example of Business Strategy: Why Referrals Matter and How They Can Make You More Money
- Example of Cashier Job Description
- Example of Customer Services, Examples of Good Customer Services, Examples Customer Services
- Example of Employment Verification Letter
- Example of Eviction Notice
- Example of Executive Summary
- Example of Executive Summary (Reports)
- Example of Executive Summary for a Business Proposal (Finance, Startup)
- Example of Fraud
- Example of GAAP
- Example of Gantt Chart
- Example of Gap Analysis
- Example of General Ledger
- Example of Gift Certificates
- Example of Gift Letter
- Example of Gift Tax
- Example of Glass Ceiling
- Example of Globalism
- Example of Globalization
- Example of Good Faith Estimate
Example of Gantt Chart
A Gantt chart is a bar chart based on a schedule. The chart relates progress in specific activities to a time frame. This type of chart is commonly used in project management. The chart can also related 'dependencies', activities dependent on completion of other activities in a project, very effectively. Graphic representation also permits a thorough oversight, and percentile representations of the work completion or lack of completion. The Gantt chart is particularly efficient in terms of complex projects, allowing relationships in activities, start and finish times, and other basic data to be clearly displayed and simplifying the task of assessment. |
Examples of Gantt Charts:
|
Construction projects IT projects Multifaceted projects https://gates.comm.virginia.edu/rrn2n/teaching/gantt.htm https://www.me.ua.edu/ME489/Gantt-Excel.pdfhttps://www.me.umn.edu/courses/me2011/handouts/proj_planning.pdf |
Image Example of Gantt Chart:
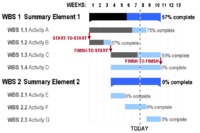 A Gantt chart showing three kinds of schedule dependencies (in red) and percent complete indications. |