Popular Examples
- Resumes
- Cover Letters
- CVs
- Idioms
- Excel Templates
- Business Examples
- Business Letters
- Love Letters
- Personal Letters
- Science
- Math Examples
More Math
- Example of Pie Chart
- Example of Square
- Example of Easy Addition
- Example of Easy Division
- Example of Easy Multiplication
- Example of Easy Subtraction
- Example of GDP Calculation
- Example of Geometric Shapes
- Example of Golden Ratio
- Example of Graph
- Example of Gutmann Scale
- Example of Hexagon
- Example of Histogram
- Example of Independent Variables
- Example of Irrational Number
- Example of Long Division
- Example of Octagon
- Example of Odd Numbers
- Example of Odds
- Example of Pivot Table
- Example of Pyramid
- Example of Ratio
- Example of Standard Deviation
- Example of Symbol
Examples of Skewed Distribution
|
Skewed distribution is derived from probability theory. It refers to a range of values for a variable, which is described as 'skewed' if the variation isn't even between measures. A negative skew means that the 'probability density' (statistical likelihood) is longer (higher valued) on the left side of a series of measures expressed as a graph relative to a mean figure. A positive skew refers to measures on the right of the mean. |
Examples of Skewed Distribution:
|
https://pirate.shu.edu/~wachsmut/Teaching/MATH1101/Descriptives/box.html https://www.uvm.edu/~dhowell/StatPages/More_Stuff/Mireault.html https://oak.cats.ohiou.edu/~yostc/QBA201/lect22/sld041.htm |
Image Example of Skewed Distribution:
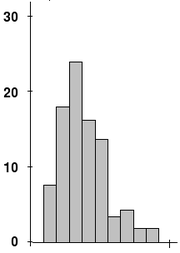 Skewed distribution of the gravitropic response in wheat coleoptiles. |